A problem with microservice management is how to analysis massive logs from different services and understand what is going on in system. In this article, we will see how we can use the EFK stack (i.e Elasticsearch, Fluentd, Kibana) to aggregate log events from our microservice from previous project for searching, analyzing and visualizing.
Getting Started
Let’s start with a short description of new components:
Elasticsearch
Elasticsearch is a NoSQL database which is based on Lucene search engine and is built with RESTful APIs. It is a highly flexible and distributed search and analytics engine. Also, it provides simple deployment, maximum reliability, and easy management through horizontal scalability. It provides advanced queries to perform detailed analysis and stores all the data centrally for quick search of the documents.Fluentd
Fluentd is an open source data collector, which lets you unify the data collection and consumption for a better use and understanding of data. Fluentd is one of supported logging drivers , it’s easy to install in our current project.Kibana
Kibana is a data visualization tool. It is used for visualizing the Elasticsearch documents and helps the developers to have an immediate insight into it. Kibana dashboard provides various interactive diagrams, geospatial data, timelines, and graphs to visualize the complex queries done using Elasticsearch. Using Kibana you can create and save custom graphs according to your specific needs.
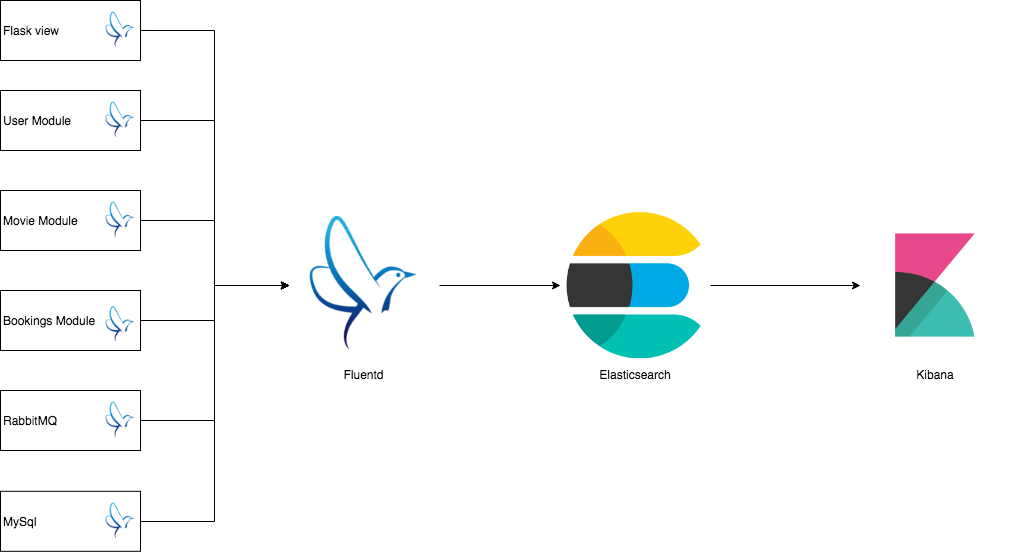
We will implement the logging feature like following diagram:
Run current project by using following command
1 | $ docker-compose up |
Setup Elasticsearch
Run elasticsearch module instance by using this command
1 | $ docker run --name search-module -d -p 33:9200 -p 34:9300 --net test-network -e "discovery.type=single-node" elasticsearch |
Setup Fluentd logs aggregation
Firstly, we need to create new forder for fluentd, then move to this forder
1 | $ mkdir fluentd |
Create a Dockerfile and paste this content into this file1
2FROM fluent/fluentd:v0.12
RUN ["gem", "install", "fluent-plugin-elasticsearch", "--no-rdoc", "--no-ri", "--version", "1.9.5"]
We will create a custom image from fluent/fluentd:v0.12 and also install the elasticsearch plugin for fluentd image. Build the custom image by this command.
1 | $ docker build -t my-fluentd . |
For running logging aggregation container we need to create a config file for fluentd. Create a file name fluentd.conf and paste following content into it
1 | <source> |
In this file, we defind source log type and setting for elasticsearch plugin
Run logging aggregation module and name it log-module by typing this command
1 | $ docker run --name log-module -d -p 35:24224 -p 35:24224/udp --net test-network -v $(pwd):/fluentd/etc -e FLUENTD_CONF=fluentd.conf my-fluentd |
Verify the Elasticsearch and Fluentd instances has been installed correct by do this testing
1 | $ docker run -rm --net=test-network --log-driver=fluentd --log-opt fluentd-address=localhost:35 --log-opt tag=docker.test ubuntu echo 'hello world' |
Then, run this command you should see the “hello world” log in the return JSON
1 | $ curl -XGET 'http://localhost:33/_all/_search?q=*' |
Setup Kibana
Run Kibana module by using this command
1 | $ docker run --name kibana-module -d -p 36:5601 --net test-network -e ELASTICSEARCH_URL=http://search-module:9200 kibana |
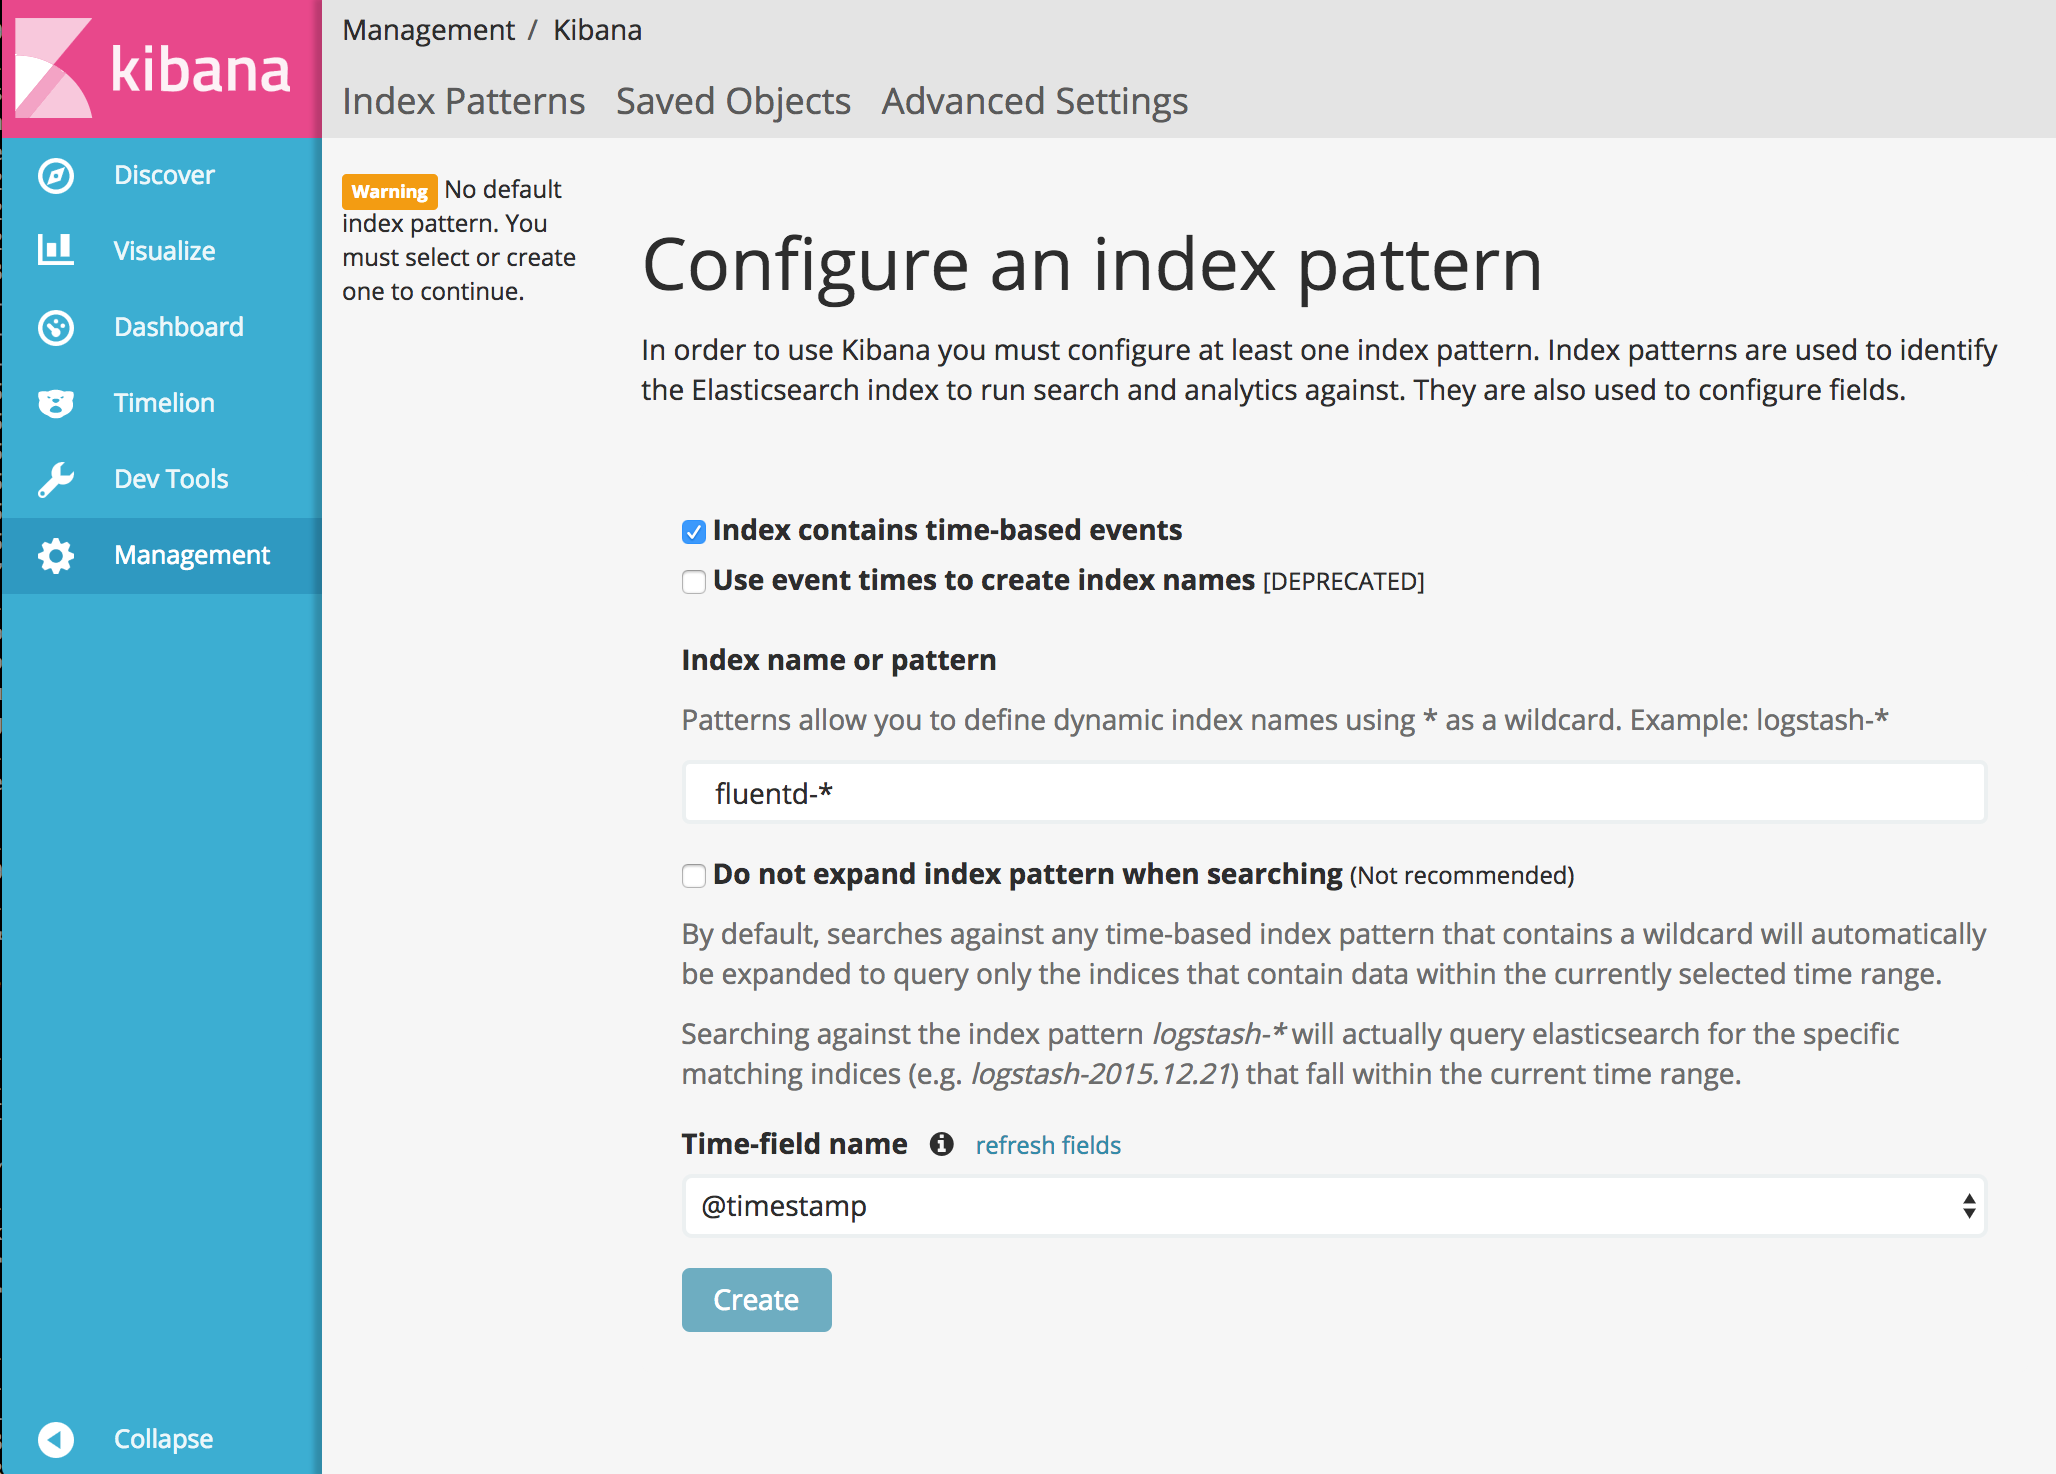
Verify the Kibana installed by opening web browser and enter http://localhost:36/ , you should see the Kibana web interface. Then, you need to set up the index name pattern for Kibana. Please specify fluentd- to Index name or pattern and press Create* button
Then, in web browser open http://localhost:30/api/# , you need to do some action with data like create/update/get some elements to database. This actions is use for generating some logs. If everything is configured correctly, you will see the this result interface when go to Discover tab to seek for the logs.
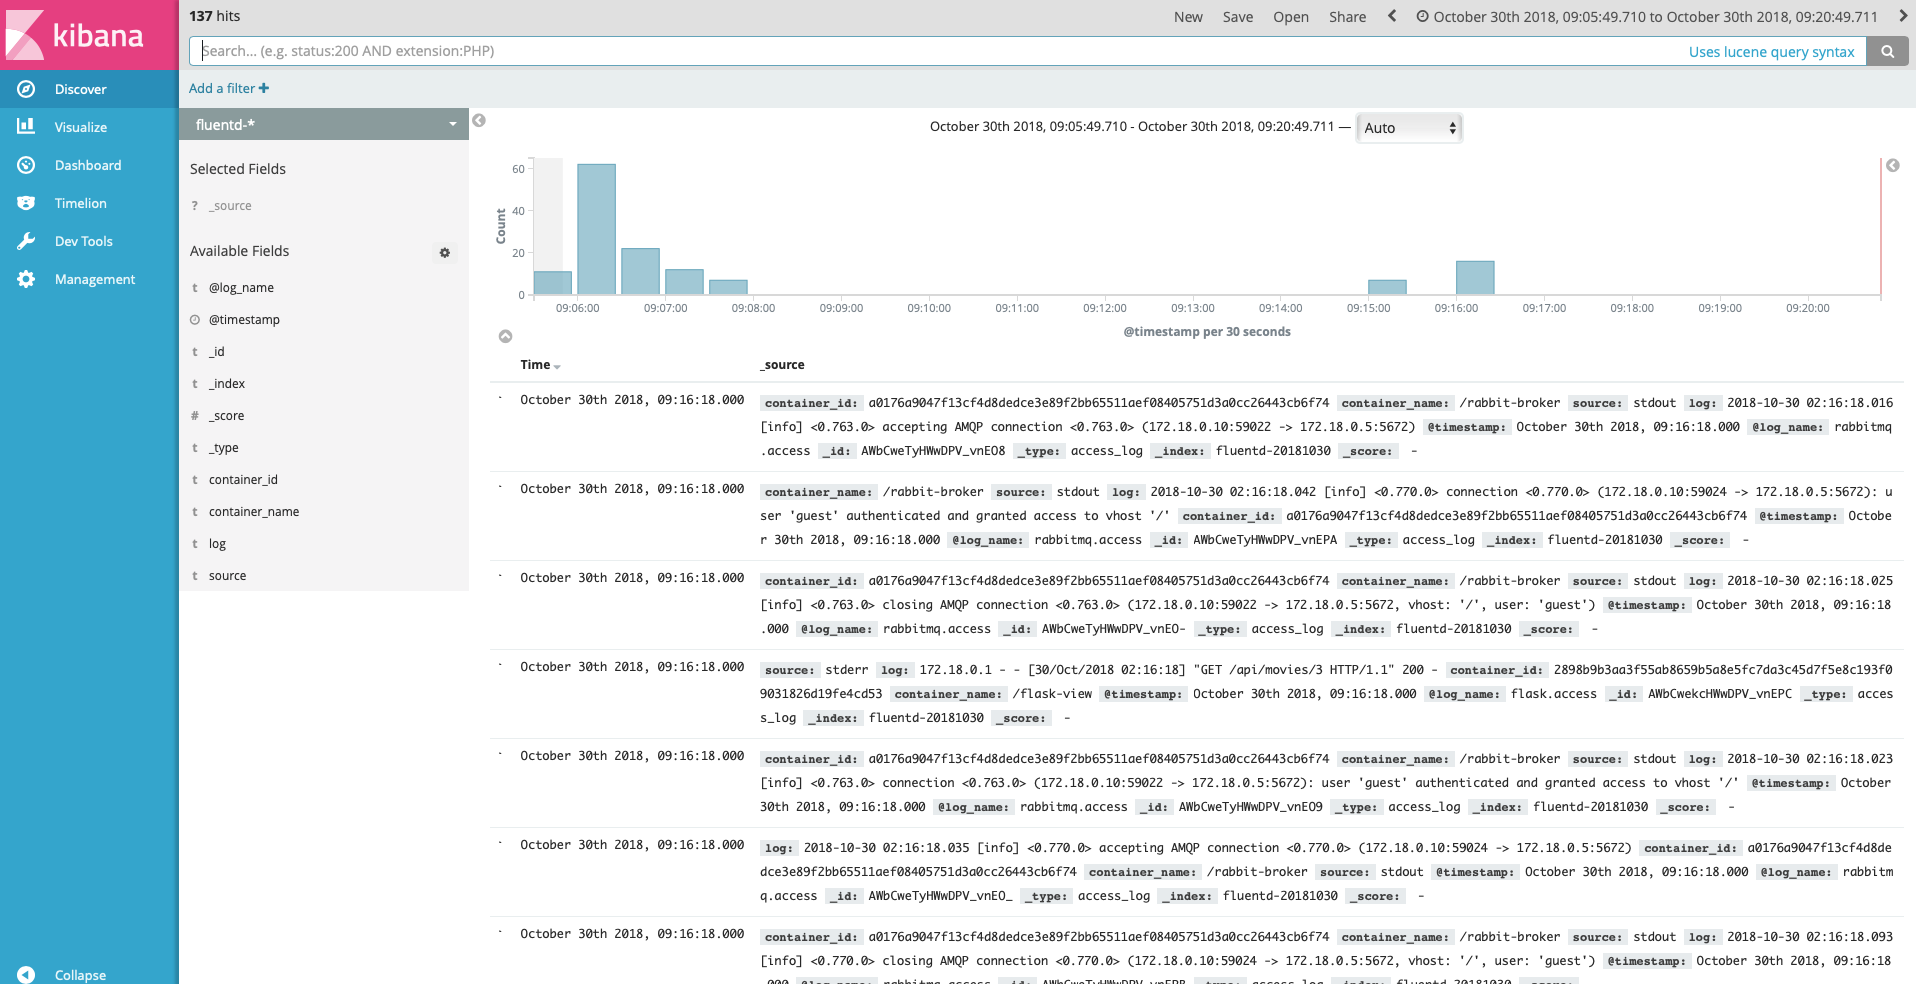
As you can see, logs are properly collected into Elasticsearch + Kibana, via Fluentd.
Create Kibana visualizations
Pie Chart
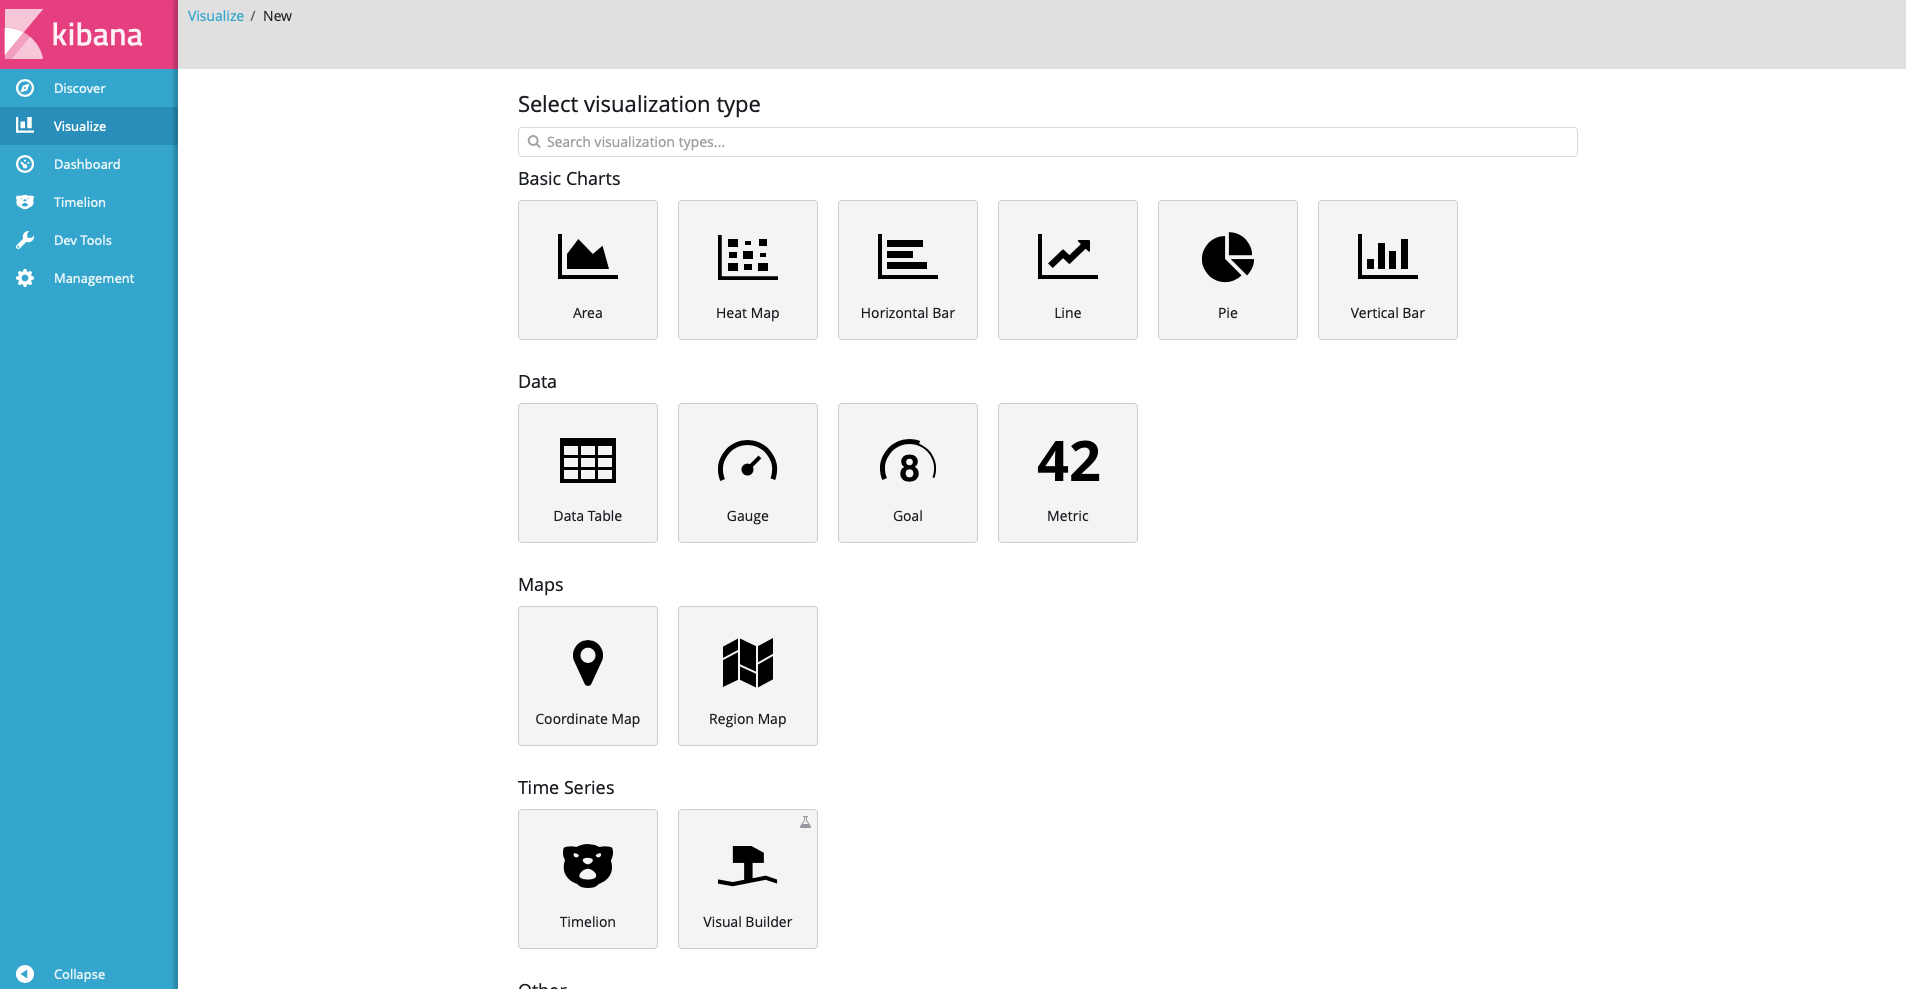
Go to Visualize tab, then select + icon to create our first data visualization
After that, you will see the the create new visualization Interface_description_language. We will create a pie chart so select pie in the interface.
In next step Choose search resource choice fluentd- from *From a New Search, Select Index list. This is the only index we have now. After that , we will see the New Visualization UI
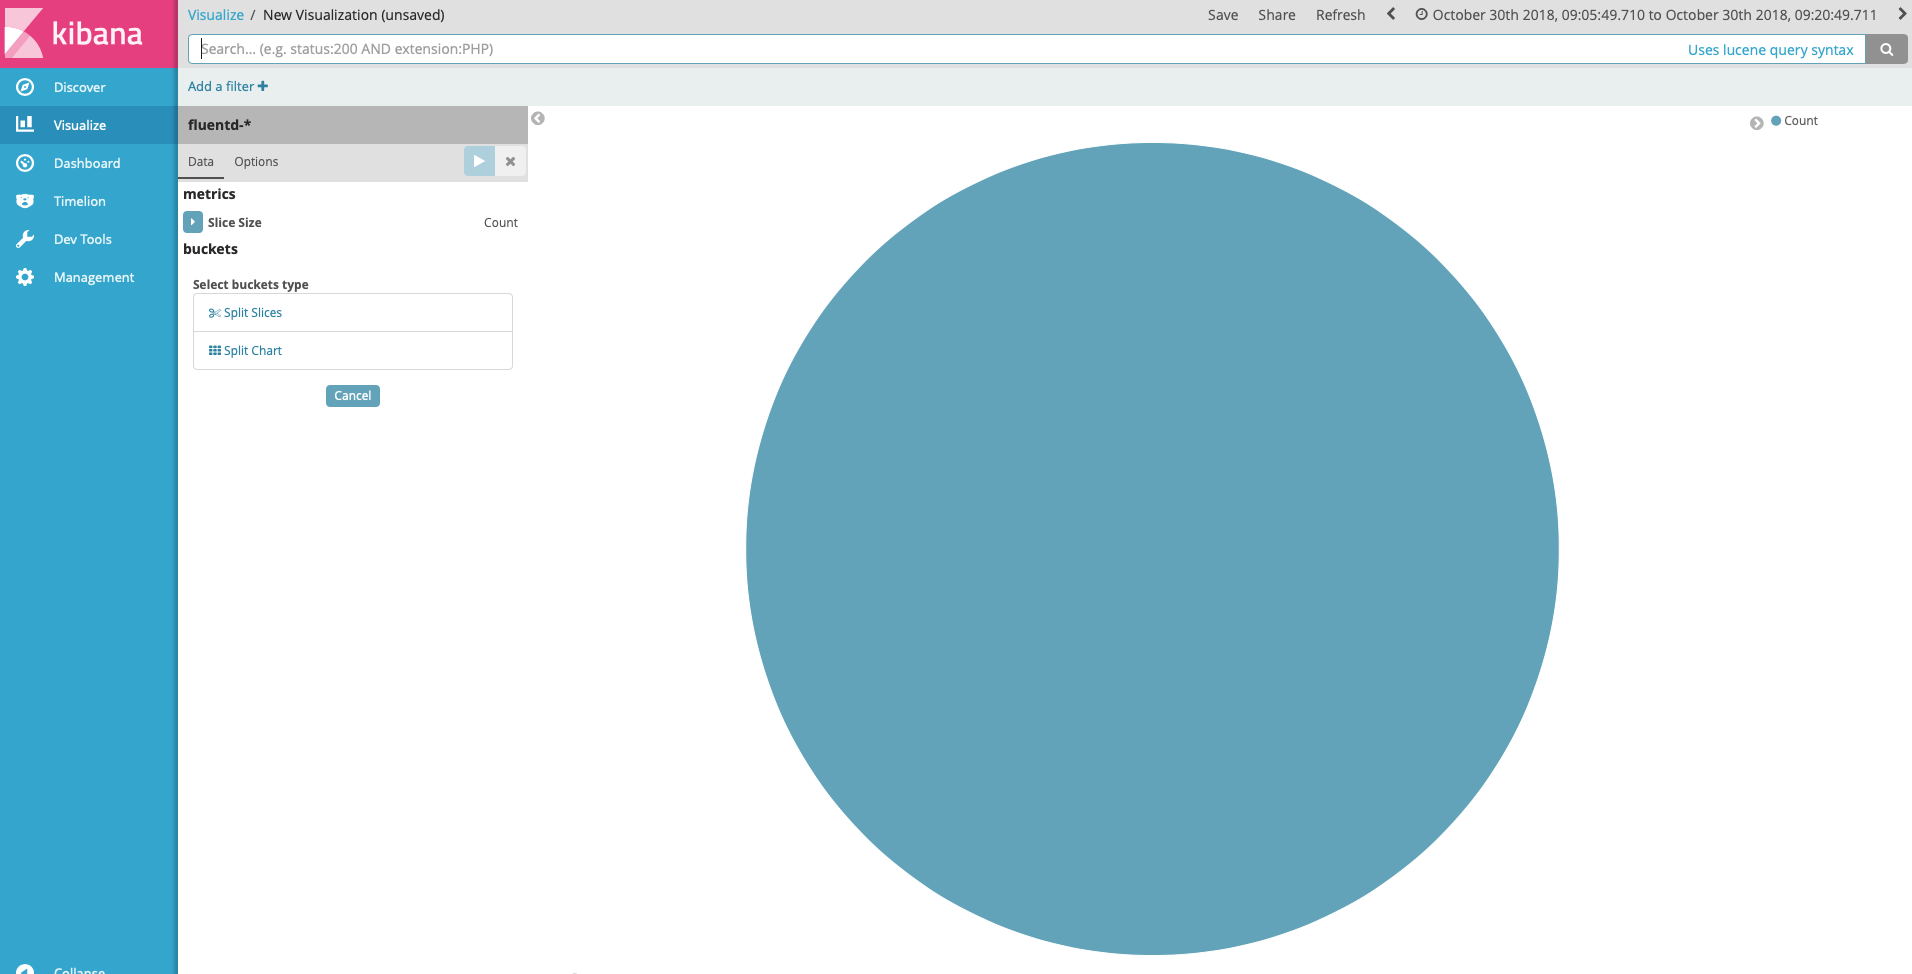
Under Select buckets type , select Split Slices then fill other fields like following screenshot
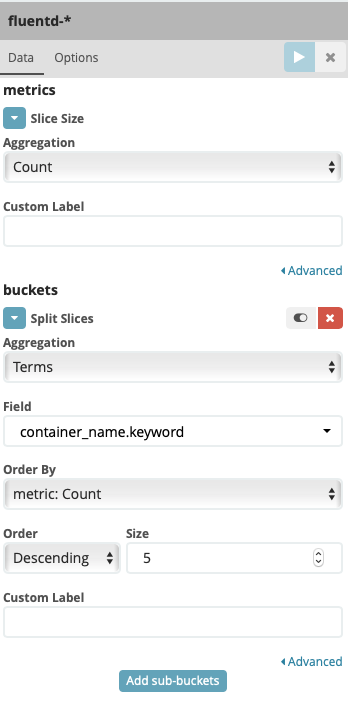
In this chart, we want to see the percent of each container in the logs. Press the play button over the setting form. This is the results
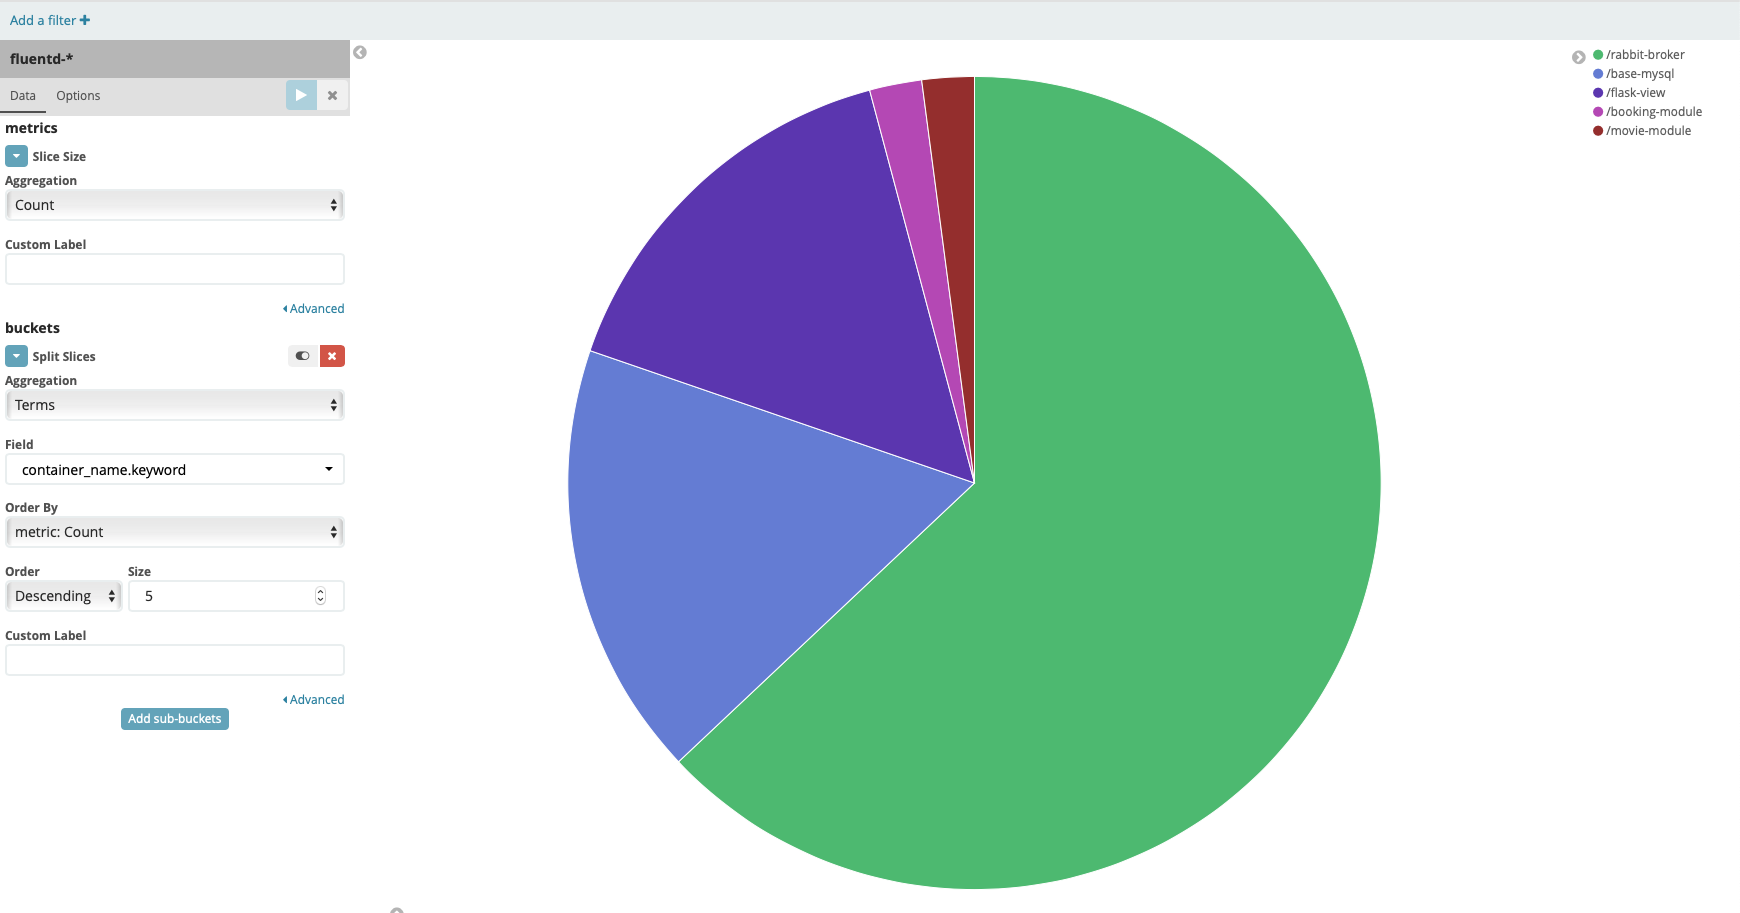
Click Save button on the top bar to save the visualization, enter the name pie chart container name
Bar Chart
We want to compare the number of logs each container has sent and the number of source of the log. The bar chart is idea for this requirement. Go back to the main Visualize dashboard , create new data visualization by select Verticle bar chart in menu. Repeat the same select index like above pie chart.
Under Select buckets type, select X-Axis then fill other field like following screenshot
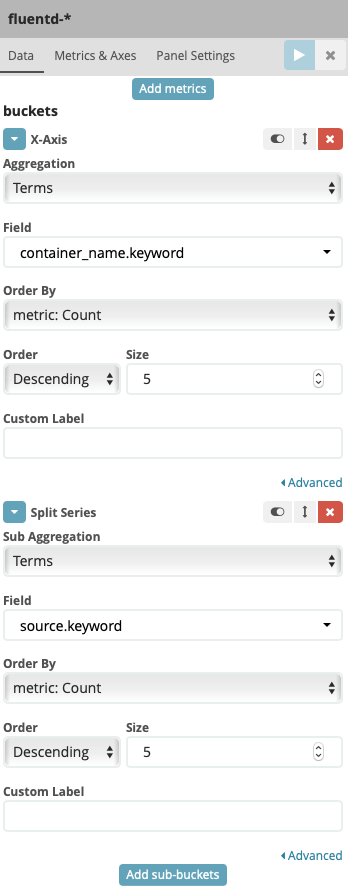
Press play button, you should see the result like this
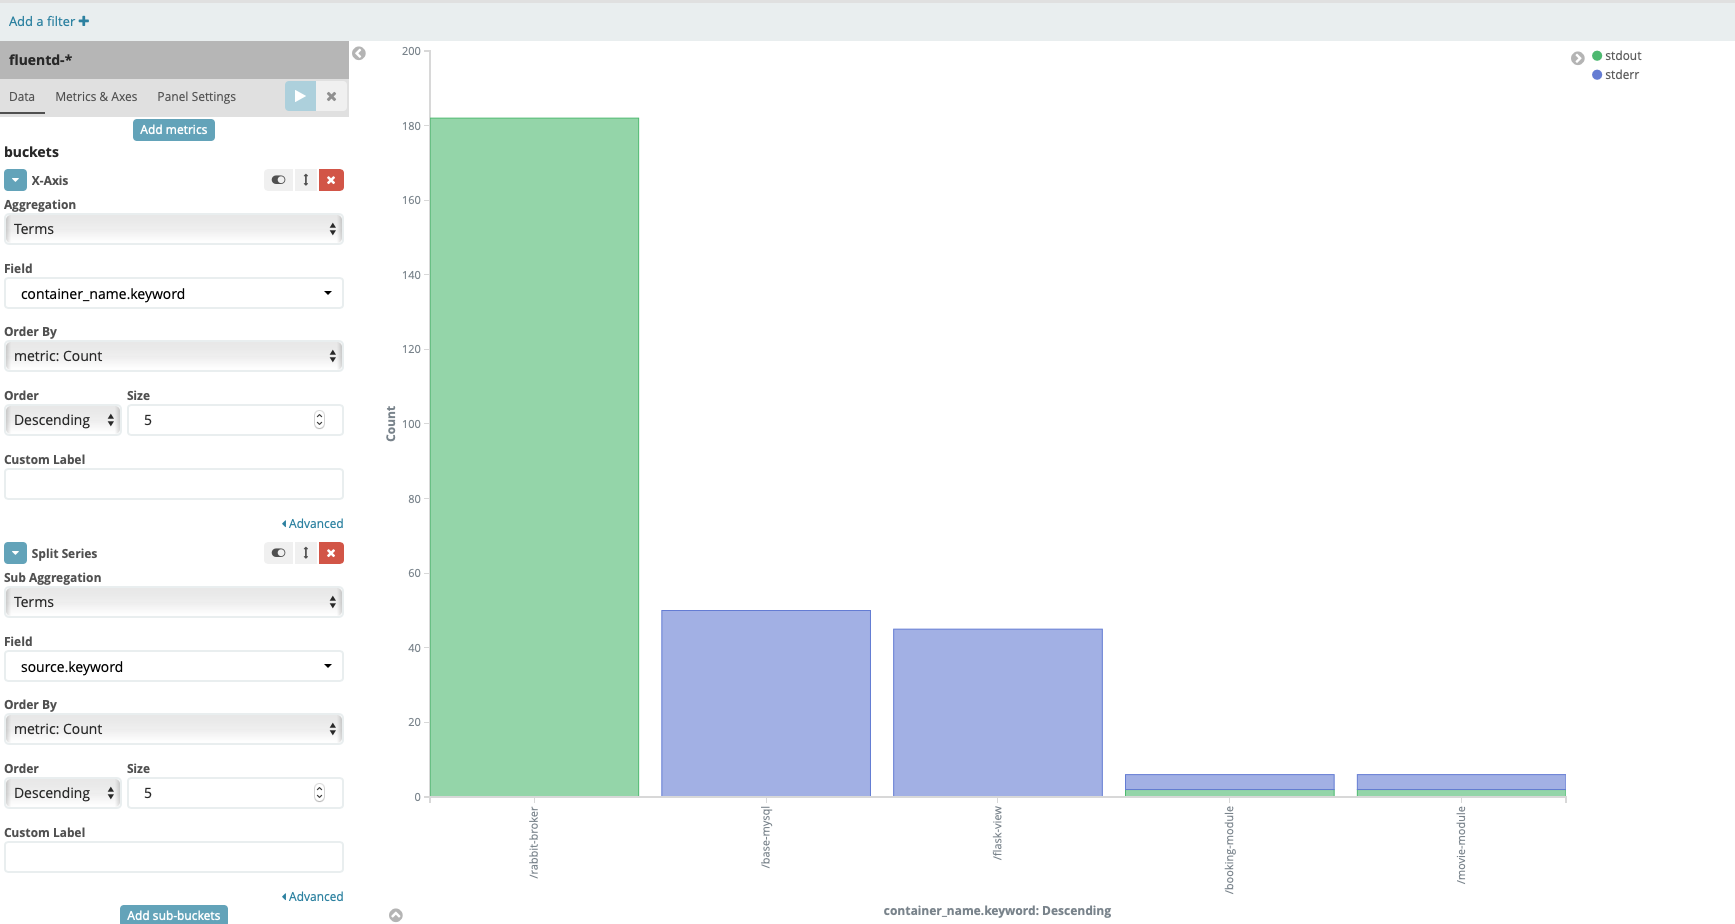
In this chart, we can see the number of log for each container and there are 2 source of logs stdout and stderr.
Click Save button on the top bar to save the visualization, enter the name bar chart container name
Area Chart
For displaying number of events over time break down by container name, we can use area chart in this case. Go back to the main Visualize dashboard , create new data visualization by select Area bar chart in menu. Repeat the same select index like above bar chart.
Under Select buckets type, select X-Axis then fill other field like following screenshot
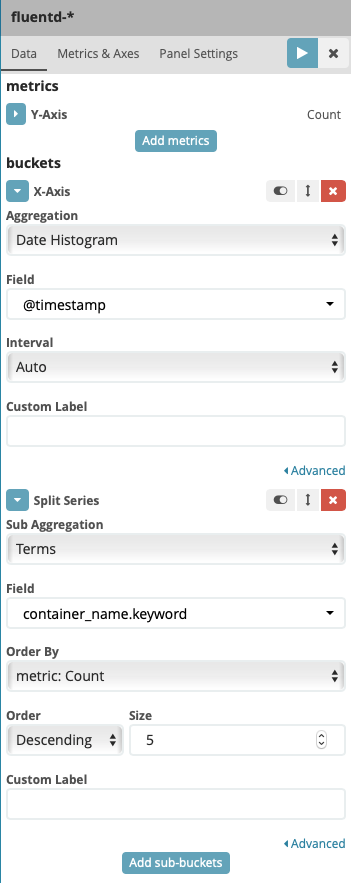
Press play button, you should see the result like this
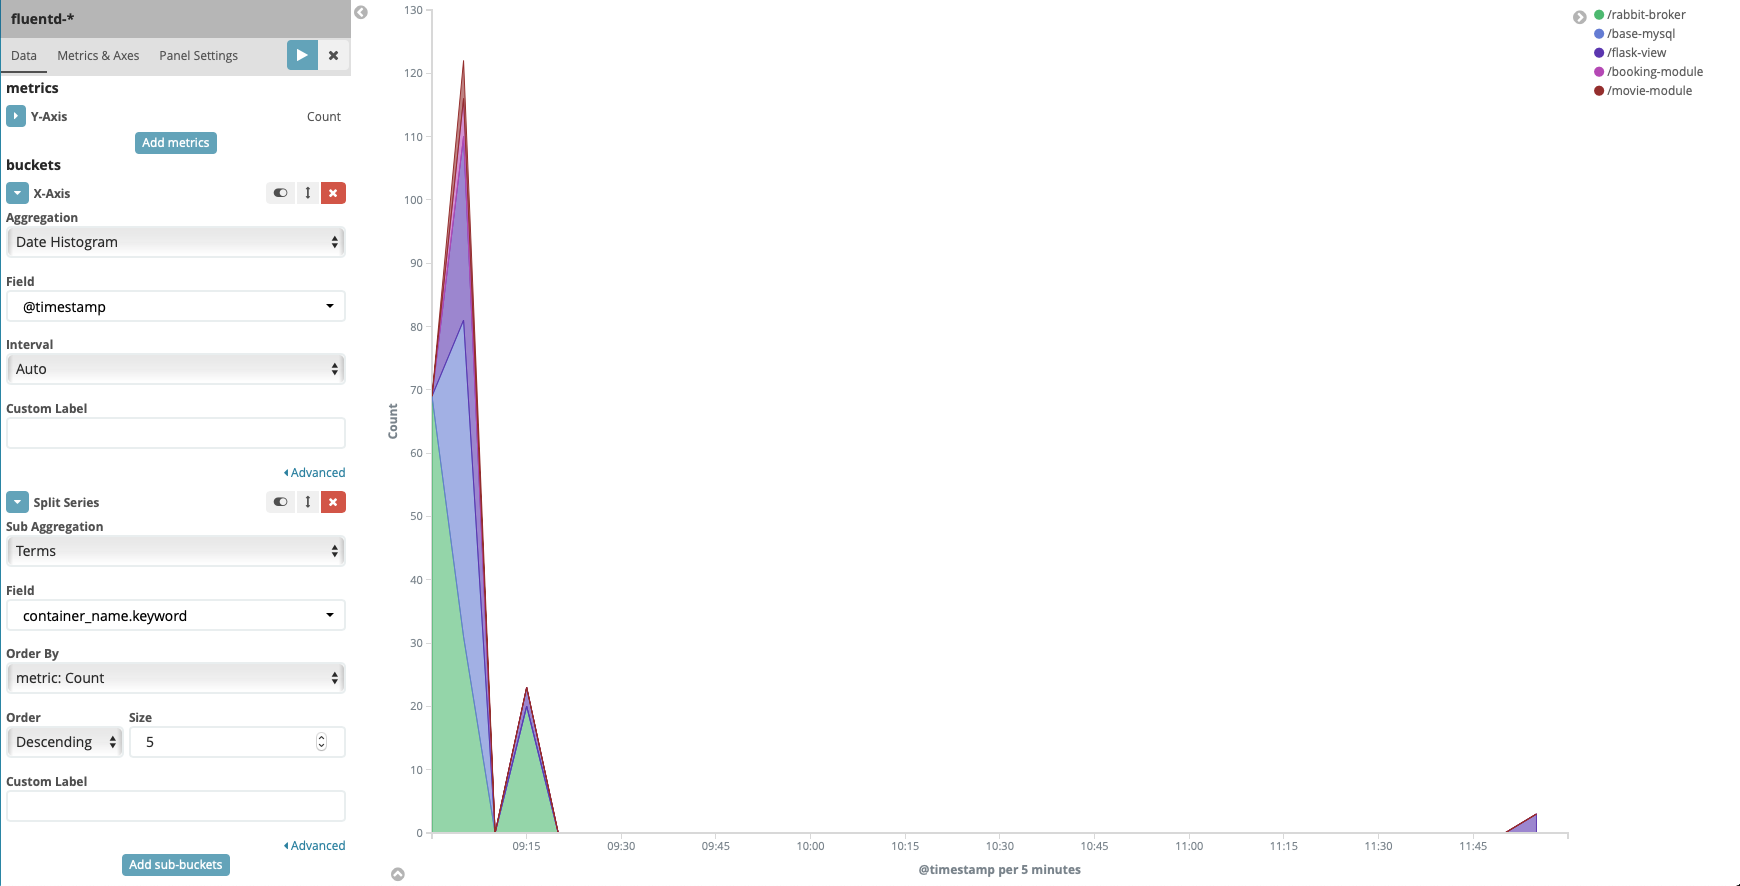
Click Save button on the top bar to save the visualization, enter the name Area chart container name
Create Kibana Dashboard
For analyzing data using visualize we created in previous section, we can create a custom dashboard for this purpose. Creating new dashboard is very simple, go to the main Dashboard dashboard, click + icon to create new dashboard then click Add button in the menu bar to open the Add Panels , in Visualization tab select all 3 visualization we created before.
Click Save button on the top bar and fill the Title for this dashboard with Test dashboard then click save.
This is the end result
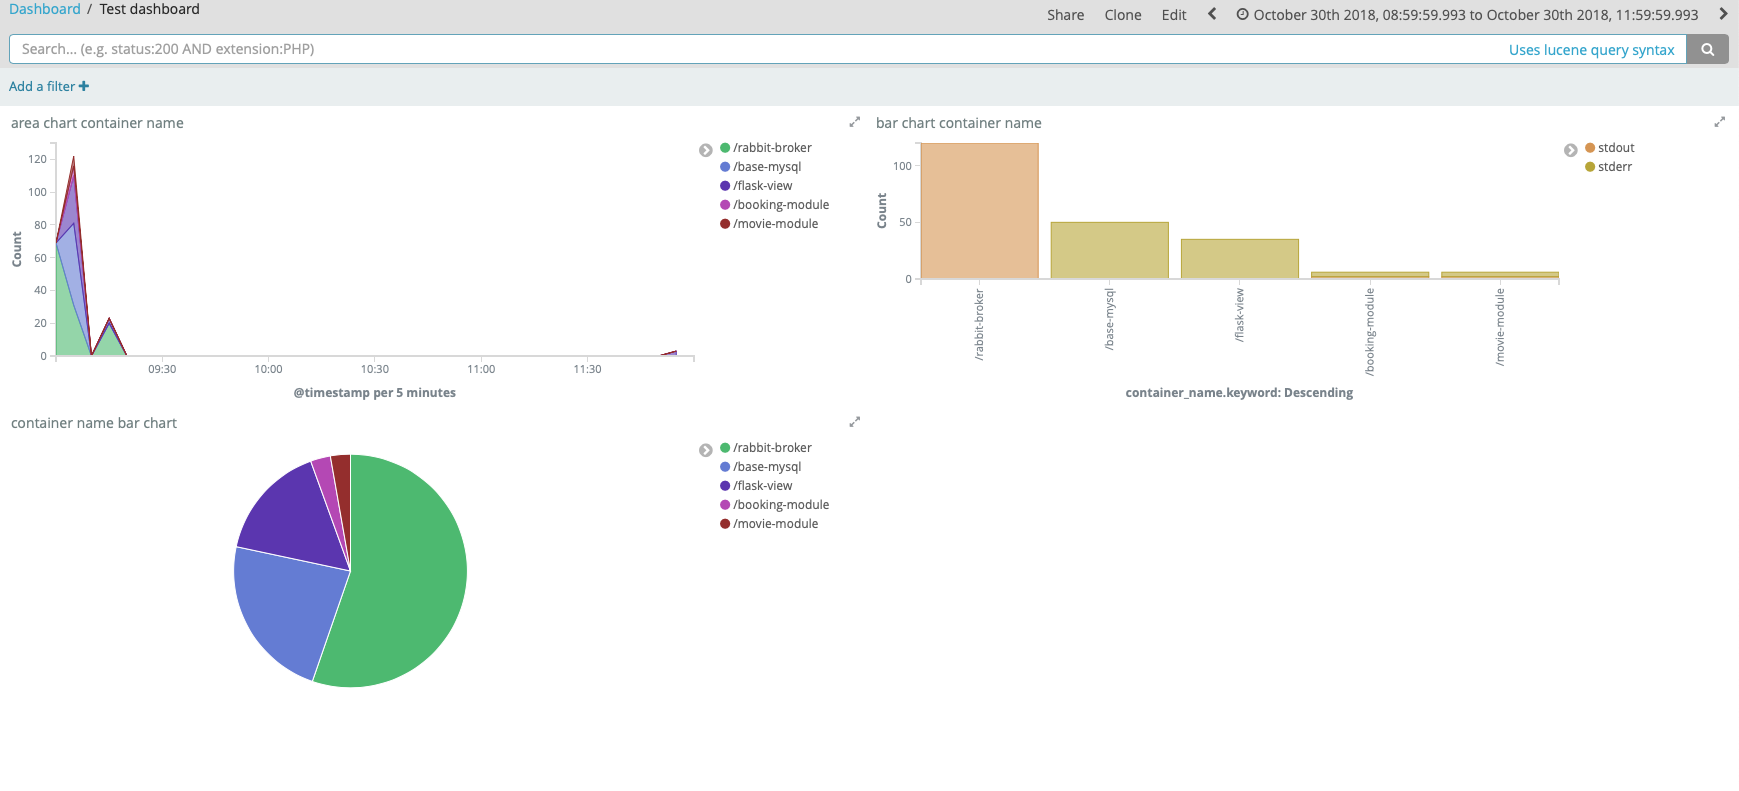
With dashboard the analyze data task become very easier for normal users. UI will be update automatic with different data set.
Containers health monitor with Metricbeat
In previous sections, we’ve used Kibana for visualizing logs data in the context of technique use case. In this section, we will see how to use metric for container health monitoring.
Metric is event that contain a timestamp and numeric values with store the information. They are sent periodically , it is different with other events in previous sections.
In this article, we will use Metricbeat to collect metric information from services in the system and start shipping data to Elasticsearch. Finally, we will visualize the data has been collected by Kibana.
Install Metricbeat
First thing need to do is create configuration file for metricbeat. In the root forder of the project create new directory named metricbeat and change working directory to this directory. Type following command to prompt
1 | $ mkdir metricbeat |
Create a file named metricbeat.yml and following content into this file
1 | metricbeat.modules: |
In this file, we define using the Docker module, Metricbeat can be configured to ship a bunch of useful information about Docker containers running on the host. We also define the output for Metricbeat to elasticsearch using address search-module:9200
Run the Metricbeat module by using this command
1 | $ docker run -d -it --name beat-module --net test-network -u root --mount type=bind,source="$(pwd)"/metricbeat.yml,target=/usr/share/metricbeat/metricbeat.yml -v /var/run/docker.sock:/var/run/docker.sock docker.elastic.co/beats/metricbeat:6.4.2 |
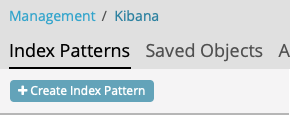
Next, open web browser and open Kibana page by type address localhost:36, select Management dashboard then select Index Patterns. In the Index Patterns UI, click Create Index Pattern button on the top of left Bar
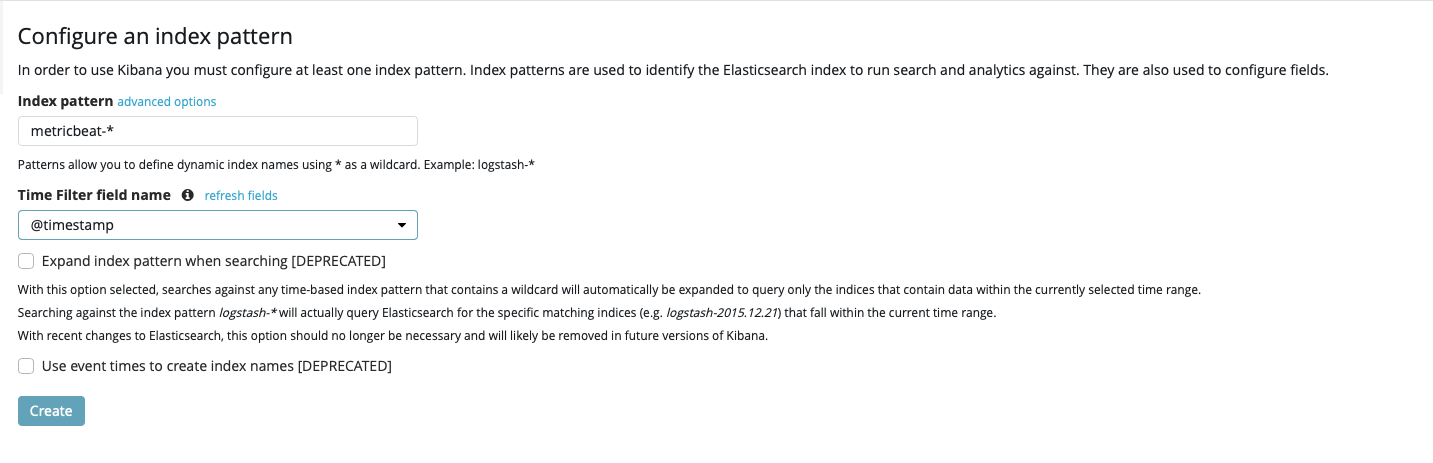
In the Configure an index pattern screen , fill the form like this screenshot to create pattern for metricbeat in kibana
Go back to Discover and select metricbeat-* in index pattern dropdown, you should see the result like this screenshot
At this point , we see the data collected by metricbeat but it’s quite hard to visualize it. In next section, we will solve it.
Set up the Kibana Dashboard
Metricbeat comes packaged with example Kibana dashboards, visualizations, and searches for visualizing Metricbeat data in Kibana. To do this, you need to provide the Kibana address for Metricbeat. Connect to beat-module by following command
1 | $ docker exec -it beat-module bash |
In the beat-module command prompt enter this command to set up Kibana address
1 | # ./metricbeat setup -E setup.kibana.host=kibana-module:5601 |
After finish installing, we can verify it by go to the Kibana page and select Visualize tab on menu bar. You should see the pre-build visualization from Metric beat has been installed
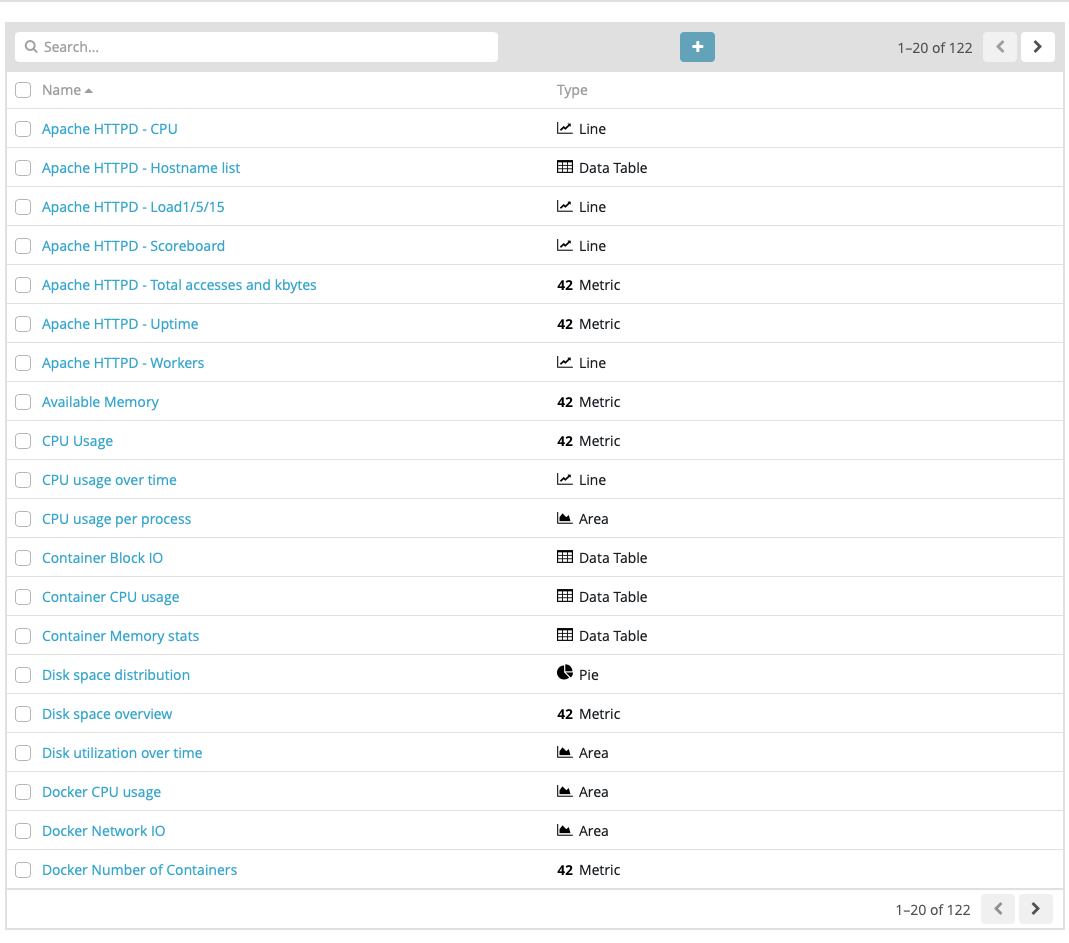
Open Dashboard tab, you should see the pre-build dashboard too
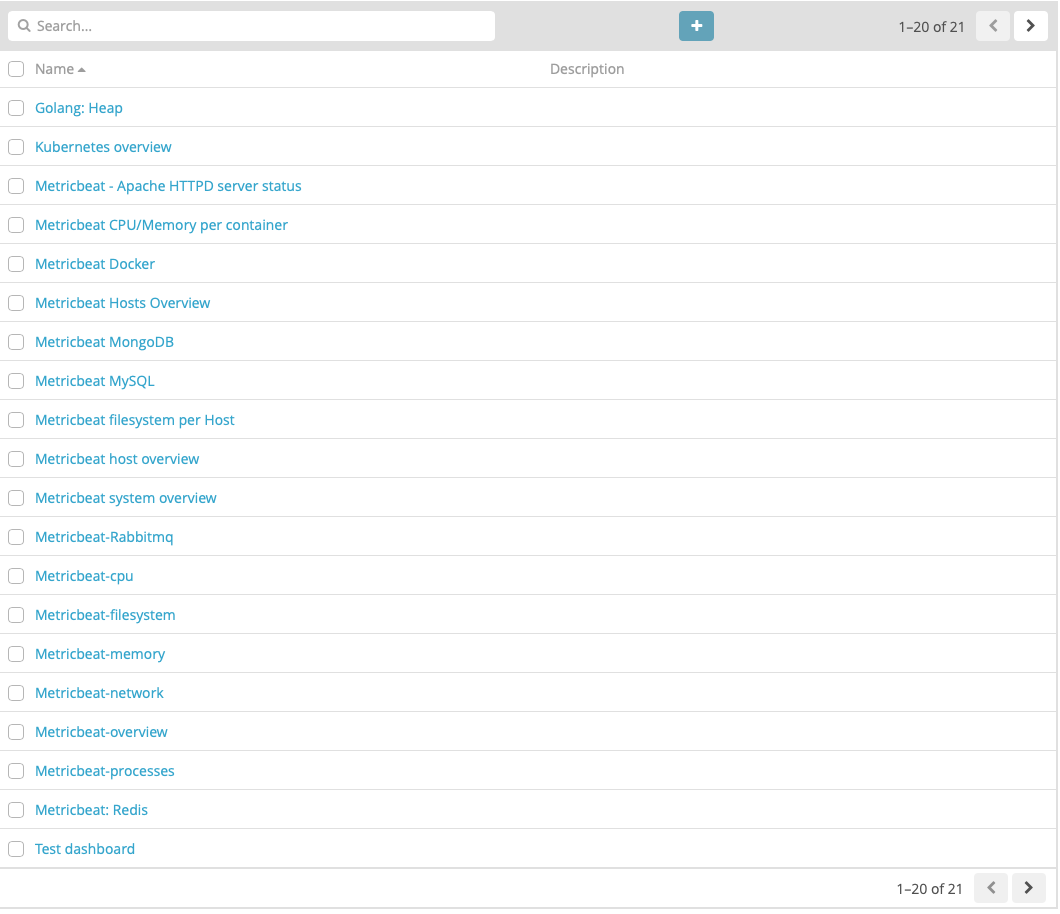
Because in this example, we use metricbeat with docker module so we can use Metricbeat docker dashboard in above list to visualize the metrics. Select Metricbeat Docker, you should see the result like this screenshot
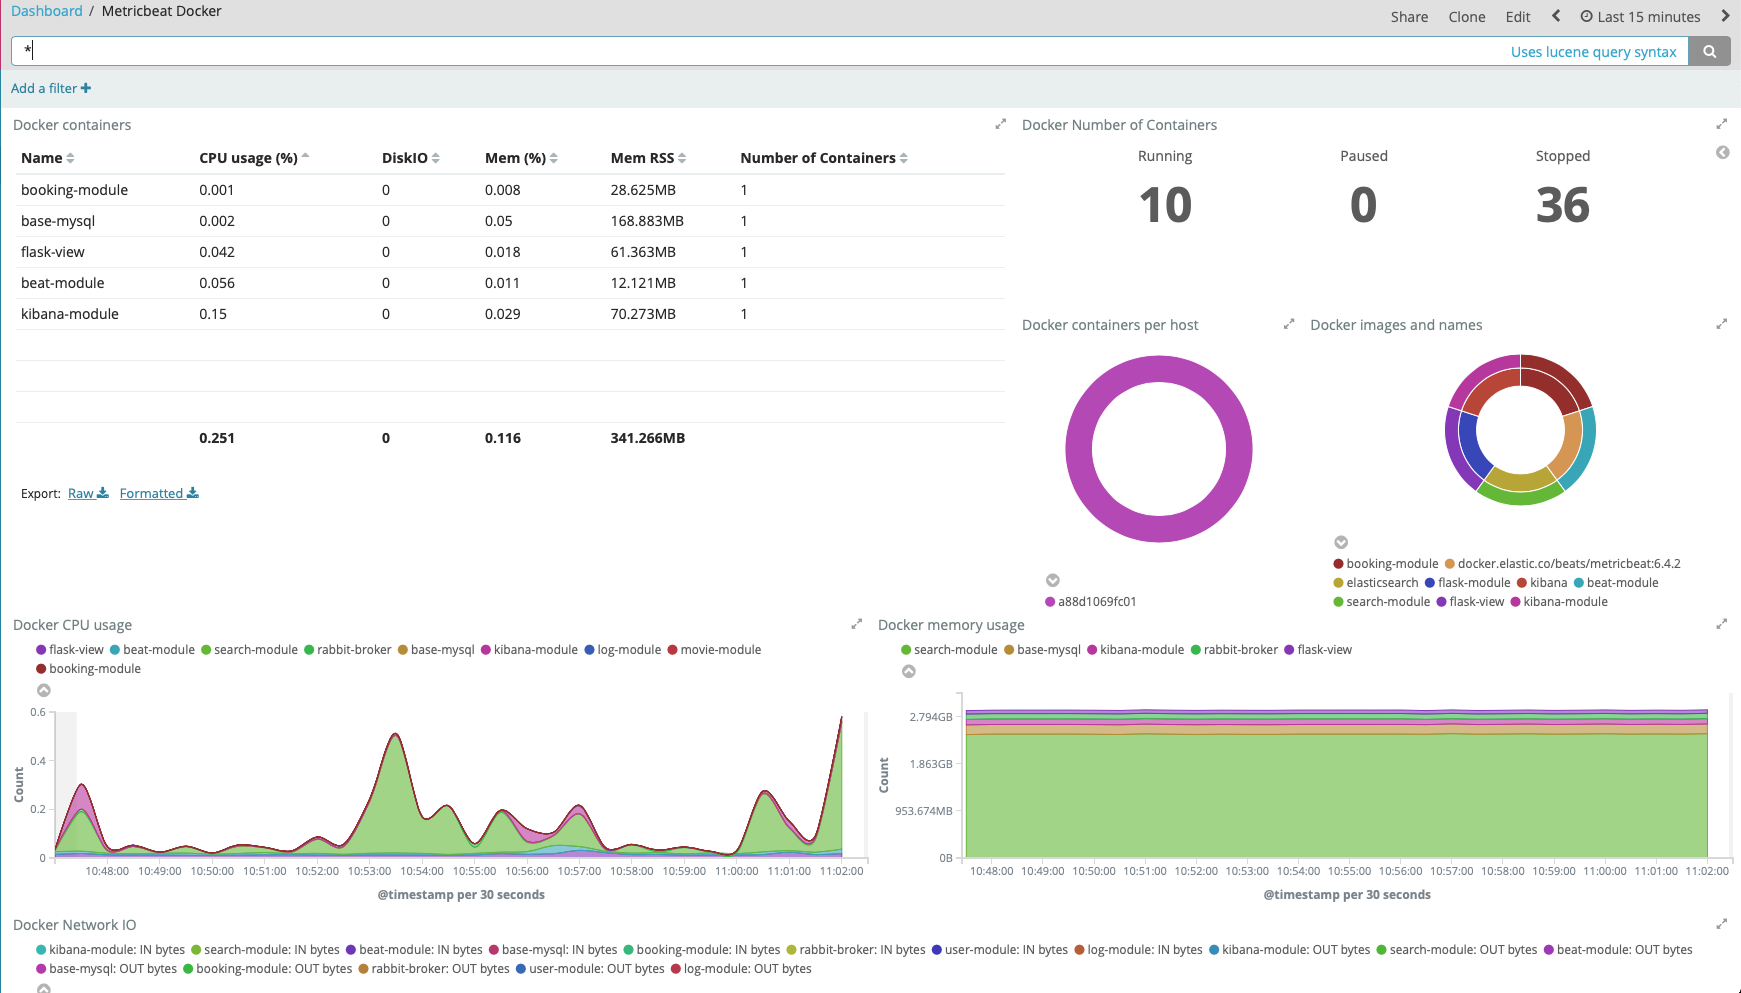
We can see how system operate over time by this dashboard. The important information about system like CPU usage, memory usage, network IO has been visualized and update automatically, Users don’t need any technique skill to understand how system currently works.
Conclusions
In this article, we’ve built a centralized logging system for debugging and monitoring for project we done in previous article. We’ve reviewed 2 technology stacks EFK(Elasticsearch, Fluentd, Kibana) and MEK (Metricbeat, Elasticsearch, Kibana) for this requirement.
Here is the final project of this part.
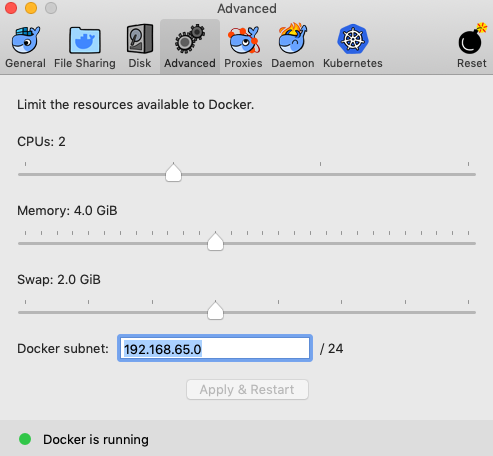
NOTE : To run project smoothly on your local device. You have to set memory for docker in Preferences to over 4GB